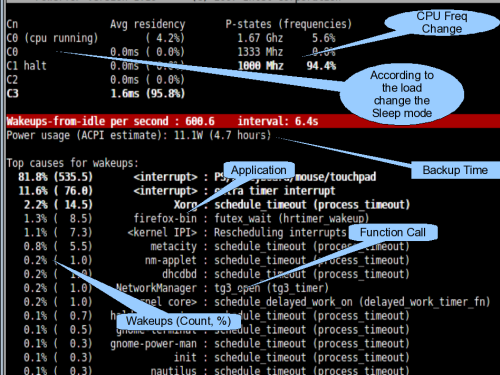
PowerTOP Screen shot with explanations.
In the top section, two CPU states, C state on left and P state on right are displayed.
C state is idle state. Expect C0 state, in all other C states, CPU will not performance any operation. While changing to higher C states, the Core Voltage, Clock, PLL, Cache state will be changed to save large amount of power. Higher C State save more power and it will take more time to come back to active (C0) state. In the screen shot, we can see that, the CPU is in 5% of time in C0 state, that is active state. And 95% of the time, it is in C4 state, so more power is saved.
P state is Performance state. In this state, according to the load, the CPU frequency is changed between a specific set of values. P0 is highest performance state and CPU will be running at maximum frequency. As state increases, CPU Frequency will be reduced, which in-turn reduces the peak thermal load.
The RED strip show the number of wake-ups (state changes from idle to active state) per second. Below that, estimated time that the system will run on battery power is shown. This info will be shown only when the system is running on battery mode. My Thinkpad R60 with Debian Lenny is running nearly ~4Hrs on battery.
The next section show the list of applications, function call, which leeds to wake-up and number of wake-ups per second are show. The total of wake-ups are show in RED strip. This session will help us to identify the application, which wake-up the CPU very frequently. We can do some optimization in the application to make it power efficient. Or we can avoid using this in battery mode.
The bottom section, which is not shown in the screen shot, will display some random suggestions to save power.
